Type-safe object pool for Unity

Managing memory usage can be crucial for decent performance in game development, especially on memory-constrained devices like mobile phones or consoles. It’s usually best to allocate what you need up-front at startup or on level load rather than mid-game during a frame, because the default memory allocators can be slow at finding free memory blocks. Constructing objects can also be time consuming depending on the complexity of your classes.

In a garbage collected, managed language like C# you still have to worry about this. You don’t know when the garbage collector is going to clean up objects that are no longer referenced in order to reclaim unused memory. If you allocate objects regularly every frame that quickly become unused and unreferenced, you’ll probably cause regular hitches in your framerate. Also in Unity the Instantiate function call can take quite a bit of CPU time.

One technique we can use to avoid these issues is called “object pooling”. Let’s say you want to spawn a firework particle effect:

fx

Instead of instantiating the prefab whenever you need it, you could pre-instantiate a list of them and disable them. Then when you need to spawn a new firework, go through the list, find one that isn’t enabled, enable it, configure its position, and play it. When it finishes, disable it. This way you re-use firework effects instead of continually creating new objects and destroying them later.

A First Attempt

A first pass on a system like this might look as follows:

using UnityEngine;
using System.Collections.Generic;

public class BasicObjectPool : MonoBehaviour
{
    // Prefab for this object pool
    public GameObject m_prefab;

    // Size of this object pool
    public int m_size;

    public void Awake()
    {
        // Instantiate the pooled objects and disable them.
        for (var i = 0; i < m_size; i++)
        {
            var pooledObject = Instantiate(m_prefab, transform);
            pooledObject.gameObject.SetActive(false);
        }
    }

    // Returns an object from the pool. Returns null if there are no more
    // objects free in the pool.
    public GameObject Get()
    {
        if (transform.childCount == 0)
            return null;

        return transform.GetChild(0).gameObject;
    }

    // Returns an object to the pool.
    public void ReturnObject(GameObject pooledObject)
    {
        // Reparent the pooled object to us and disable it.
        var pooledObjectTransform = pooledObject.transform;
        pooledObjectTransform.parent = transform;
        pooledObjectTransform.localPosition = Vector3.zero;
        pooledObject.gameObject.SetActive(false);
    }
}

Note that our Get method returns null if there are no more objects in the pool. We could also dynamically increase the size of the pool here, but that defeats the purpose of pre-allocating the objects. It’s up to the code calling Get to check if no object is available and handle that situation. In practice you would pick a pool size that adequately covers the maximum number of objects you would like to have available at any one time. It’s not feasible to just keep spawning objects – you’ll run out of memory if you do!

This solution isn’t bad, but I have one big problem with it. The pool doesn’t know what type of component you’re pooling! This means that you have to do a GetComponent call every time you get an object out of the pool. It also means that there are no guarantees that the pool even HAS the component type you’re expecting; you can’t enforce it, so someone could mis-configure it in a prefab or a scene.

Can we do better? Yes! With generics!

Generics

Generics are a feature of the C# language. They let you design a class or write a method with a placeholder type, which means you can write classes or methods that work with any data type, and still remain type safe. Unity makes use of them, and in fact if you use Unity’s GetComponent<..>() methods you, are already using them yourself.

This line:

fooGameObject.GetComponent<FooComponent>()

gets the MonoBehaviour of type FooComponent which is on fooGameObject. How can this work? The Unity developers don’t know anything about your FooComponent. This syntax with the angled brackets indicates that the GetComponent method is a generic method which can work with any type (actually, specifically any MonoBehaviour type). When you call the method and put your type in the angled brackets, you tell the compiler to automatically generate a version of GetComponent that knows specifically about your type.

For more detailed information about generics, check out this introduction from Microsoft.

Improved Implementation

Let’s implement our object pool class using generics. First we need to define a generic version of the class that accepts a type name. We want to pool Unity components, so we’ll also add a constraint on the type which says that it must be a MonoBehaviour:

public class ObjectPool<T> : MonoBehaviour where T : MonoBehaviour

The where keyword defines the constraint. There are several different types of constraints we can specify. In our case we want the constraint that says “the type MUST derive from MonoBehaviour”.

Now that we have the class defined like this, we can use the generic type placeholder T anywhere that we want to refer to the type that the pool was created with:

public class ObjectPool<T> : MonoBehaviour where T : MonoBehaviour
{
    // Prefab for this pool. The prefab must have a component of type T on it.
    public T m_prefab;

    // Size of this object pool
    public int m_size;

    // The list of free and used objects for tracking.
    // We use the generic collections so we can give them our type T.
    private List m_freeList;
    private List m_usedList;

    public void Awake()
    {
        m_freeList = new List(m_size);
        m_usedList = new List(m_size);

        // Instantiate the pooled objects and disable them.
        for (var i = 0; i < m_size; i++)
        {
            var pooledObject = Instantiate(m_prefab, transform);
            pooledObject.gameObject.SetActive(false);
            m_freeList.Add(pooledObject);
        }
    }
}

Let’s now add two methods: one to get an object out of the pool and one to return an object back to the pool. Previously we passed GameObjects around because we didn’t know what type we would be dealing with. Now that we are using generics, we can use our placeholder T:

public T Get()
{
    var numFree = m_freeList.Count;
    if (numFree == 0)
        return null;

    // Pull an object from the end of the free list.
    var pooledObject = m_freeList[numFree - 1];
    m_freeList.RemoveAt(numFree - 1);
    m_usedList.Add(pooledObject);
    return pooledObject;
}

// Returns an object to the pool. The object must have been created
// by this ObjectPool.
public void ReturnObject(T pooledObject)
{
    Debug.Assert(m_usedList.Contains(pooledObject));

    // Put the pooled object back in the free list.
    m_usedList.Remove(pooledObject);
    m_freeList.Add(pooledObject);

    // Reparent the pooled object to us, and disable it.
    var pooledObjectTransform = pooledObject.transform;
    pooledObjectTransform.parent = transform;
    pooledObjectTransform.localPosition = Vector3.zero;
    pooledObject.gameObject.SetActive(false);
}

And we’re done! You can see the full class over on github. Now, we can’t actually add this class to a GameObject yet. As it stands, the class is just a kind of template. It doesn’t really exist as any concrete code until we declare it somewhere with a concrete type.

Let’s assume that we have an Explosion MonoBehaviour which is on a prefab:

public class Explosion : MonoBehaviour
{
    private ParticleSystem m_particleSystem;

    public bool IsAlive { get { return m_particleSystem.IsAlive(); } }

    public void Awake()
    {
        m_particleSystem = GetComponent<ParticleSystem>();
    }

    public void Spawn(Vector3 position)
    {
        gameObject.SetActive(true);
        gameObject.transform.position = position;
        m_particleSystem.Play();
    }
}

We want to create a pool of Explosion objects. To do this, we must define a new class which derives from ObjectPool with the Explosion as our type parameter:

public class ExplosionPool : ObjectPool<Explosion>
{
}

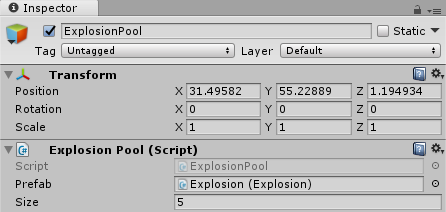
And that’s it! You can now add ExplosionPool to a GameObject, and assign a prefab to it. The ObjectPool‘s m_prefab field will appear in the inspector, and it will only allow you to drop an Explosion component on it. It’s strongly typed!
objectpool

Now to spawn an explosion, you can do this:

public void SpawnExplosion(Vector3 position)
{
    var explosion = m_explosionPool.Get();
    if (explosion == null)
    {
        // The pool is empty, so we can't spawn any more at the moment.
        return;
    }

    explosion.Spawn(position);
    m_activeExplosions.Add(explosion);
}

In the above example we also keep track of the active explosions so we can return them to the pool when they are finished:

public void Update()
{
    for (var i = 0; i < m_activeExplosions.Count - 1; i >= 0; i--)
    {
        var explosion = m_activeExplosions[i];
        if (!explosion.IsAlive)
        {
            m_activeExplosions.RemoveAt(i);
            m_explosionPool.ReturnObject(explosion);
        }
    }
}

Over on github I have a sample Unity project that demonstrates both the non-type-safe and type-safe methods. It’s a simple project that fires some particles from a pool when you click in the game window.

Feel free to hit me up on Twitter if you have any questions, or leave a comment below!

Decoding iOS crash call stacks

Wow it’s been a while since I updated the blog! I think we’re due for a web site refresh too. But first let’s talk about call stacks!

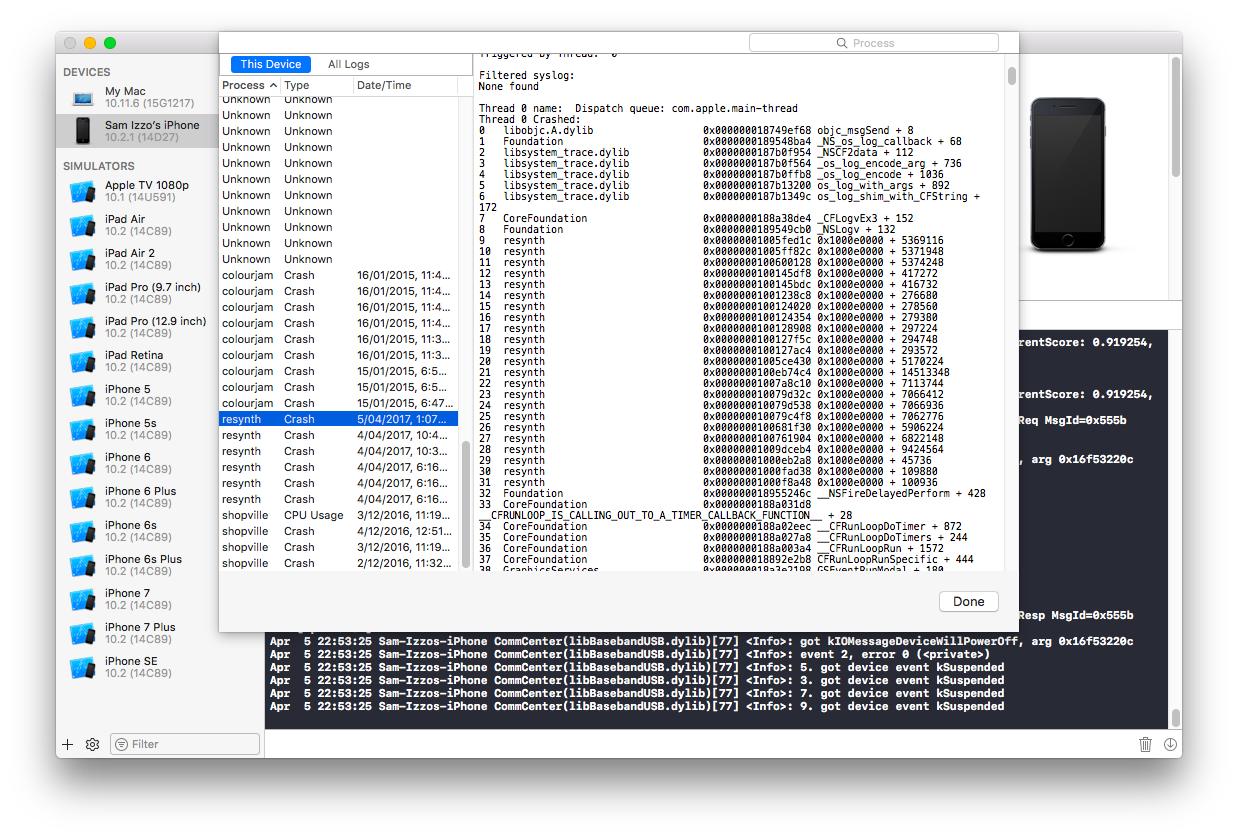
Let’s say your iOS game crashes outside of the debugger. Assuming your device is plugged into your mac, you can get the device log from Xcode by bringing up the “Devices” window via Window -> Devices. You should see a live updated log and you might be able to find your crash details in among the spammy output. But even better – if you click on “View Device Logs” you’ll see a list of apps that have crashed.

Screen Shot 2017-04-05 at 10.53.50 PM

In this example, Resynth (a game I’ve been working on for my new company Polyphonic LP) has crashed a couple of times, and I’ve selected one of the crashes.

Why did it crash? Luckily we have the full call stack. A call stack is simply a list of functions that are currently being executed by the CPU. In this case, the call stack looks like this:

Thread 0 Crashed:
0   libobjc.A.dylib               	0x000000018749ef68 objc_msgSend + 8
1   Foundation                    	0x0000000189548ba4 _NS_os_log_callback + 68
2   libsystem_trace.dylib         	0x0000000187b0f954 _NSCF2data + 112
3   libsystem_trace.dylib         	0x0000000187b0f564 _os_log_encode_arg + 736
4   libsystem_trace.dylib         	0x0000000187b0ffb8 _os_log_encode + 1036
5   libsystem_trace.dylib         	0x0000000187b13200 os_log_with_args + 892
6   libsystem_trace.dylib         	0x0000000187b1349c os_log_shim_with_CFString + 172
7   CoreFoundation                	0x0000000188a38de4 _CFLogvEx3 + 152
8   Foundation                    	0x0000000189549cb0 _NSLogv + 132
9   resynth                       	0x000000010056ac28 0x10004c000 + 5368872
10  resynth                       	0x000000010056b654 0x10004c000 + 5371476
11  resynth                       	0x000000010056bdd4 0x10004c000 + 5373396
12  resynth                       	0x00000001000b13f4 0x10004c000 + 414708
13  resynth                       	0x0000000100081c94 0x10004c000 + 220308
14  resynth                       	0x00000001000816f4 0x10004c000 + 218868
15  resynth                       	0x000000010053a33c 0x10004c000 + 5169980
16  resynth                       	0x0000000100e23404 0x10004c000 + 14513156
17  resynth                       	0x0000000100714b54 0x10004c000 + 7113556
18  resynth                       	0x0000000100714f24 0x10004c000 + 7114532
19  resynth                       	0x0000000100708054 0x10004c000 + 7061588
20  resynth                       	0x0000000100709db4 0x10004c000 + 7069108
21  resynth                       	0x000000010070a0a8 0x10004c000 + 7069864

There isn’t much symbol information; the only thing we can really see is that the NSLog function was running. But what called NSLog and what caused it to crash?

Fortunately there are several tools we can use to decode this. I’m going to cover one of them today: atos. atos converts memory addresses to symbol names, and it comes with macOS and lives in /usr/bin so it should already be in your path. It takes a couple of parameters:

atos -arch <architecture> -l <load address> -o <path to debug binary> <addresses>

We need to supply the architecture of our binary, the load address (the base address in memory where the executable was loaded), the path to a version of our binary with full debug information present, and the list of call stack addresses that we wish to translate into symbols.

If you have archived your game from Xcode, the full debug executable can be found inside the archive, in dSYMs/resynth.app.dSYM/Contents/Resources/DWARF.

Our architecture is arm64 (unless you’re running arm7 which is unlikely these days).

For this crash our load address is 0x10004c000. The load address could be anything and won’t always be the same. Sometimes the load address might not be present, and the call stack lines might look something like this:

9   resynth                       	0x000000010056ac28 resynth + 5368872

This can happen if you get your crash information from the device log view in Xcode instead of from the specific application crash view.

Here 0x000000010056ac28 is the real memory address where this particular function was loaded, and 5368872 is the offset of the function from the load address. We can therefore easily calculate the load address; it’s just 0x000000010056ac28 - 5368872 which is 0x10004C000.

Now we have everything we need, so let’s run this!

$ atos -arch arm64 -l 0x10004c000 -o resynth-debug 0x000000010056ac28 0x000000010056b654 0x000000010056bdd4
CM_NSLog(NSString*, ...) (in resynth-debug) (CloudManager.mm:17)
-[CloudManager getLongLong:] (in resynth-debug) (CloudManager.mm:171)
getLongLong (in resynth-debug) (CloudManager.mm:225)

In the interests of brevity I’ve used only the three top most addresses. This is usually enough to figure out the problem anyway!

In this case the culprit turns out to be the getLongLong Objective-C method:

- (long long) getLongLong:(NSString *)key
{
    NSUserDefaults* userDefaults = [NSUserDefaults standardUserDefaults];
    long long value = [[userDefaults objectForKey:key] longLongValue];
    DEBUG(@"CloudManager: getLongLong key=%@ value=%@", key, value);
    return value;
}

On line 5 we specify a string with the %@ format specifier, which means we should be passing in an NSObject-derived object. However, we are instead passing a long long value which causes a crash.

The fix is simple. We just convert the long long to an NSObject:

DEBUG(@"CloudManager: getLongLong key=%@ value=%@", key, @(value));

Hdg Remote Debug – How It Works

Hdg Remote Debug works using .NET’s reflection features; it doesn’t use any sort of built-in Unity serialisation. Every second it gathers all GameObjects that are currently active, finds all Components on them, and for each component, uses reflection to find all serialised and public fields. This data is sent back to the client running in the editor over a network connection, where the data is displayed in custom hierarchy and inspector windows.

This means it doesn’t use the built-in Unity inspectors or any custom inspectors you may have created, so when you click on, say, a Camera object you see the public and serialised fields of the Camera type rather than what Unity’s built-in CameraEditor inspector would have shown.

I would like to fix this and use the built-in inspectors and I have actually prototyped it extensively but it turns out there are several problems. To use the built-in inspectors we require a proxy GameObject that represents the selected object on the server. The idea is that whenever we receive a message from the server, we create a new proxy GameObject, dynamically add all components to it, and for each component, create an Editor instance with Editor.CreateEditor(component). When drawing the UI for the components, we just call Editor.OnInspectorGUI for each one and use BeginChangeCheck/EndChangeCheck to determine if anything changed. If fields have changed we send a message to the server to update it.

There are a couple of problems with this approach. The built-in inspectors cause undo events to be added to the system, but those undo events are undesirable; the GameObject is a temporary proxy object for which we don’t want to track undo events. In fact the object is not visible in the scene, so the undo events seem spurious to the user. It’s not a good user experience to generate all these undo events that go nowhere.

Another problem is that EndChangeCheck doesn’t detect that changes have happened when certain fields are changed. One such field that I found was the camera mask property. It seems to be something to do with the EditorGUI.PropertyField, which doesn’t seem to set GUI.changed to true.

The last major problem is with the proxy GameObject. We create a new proxy every time we receive a message from the server, but destroying the previous one seems to cause the Editor objects that we created to throw NullReferenceExceptions when you hit play or when Unity reloads assemblies, when it tries to reinitialise its serializedObject field. I think I need to find a way to clear the reference on the Editor when destroying the GameObject, but it wasn’t possible when I last investigated. I can’t just leave the proxy object; that’s a memory leak!

I have a Trello roadmap board with some features I’d like to add. Some are wishlist features which may not really be possible without digging into the Unity source (e.g. hotswapping prefabs, or the aforementioned built-in inspectors). One feature I would like to add is an extensible console system, where you can hook in your own commands to control the game remotely. That way you can add debug features to the game that you can then control from Unity.

Get in touch if you have any questions or feature requests for Hdg Remote Debug!

Remote debug / live update of Unity builds on device

Unity has a feature called the Unity Remote which is an app that you run on an Android or iOS device. The editor talks to this app via USB and sends the render output of the game as it is running in the editor to the device. The touch inputs from the device along with other device-specific data such as GPS and accelerometer are also sent back to the editor. This gives you an idea of how your game looks on a device and also lets you test touch controls and other device hardware without having to constantly do full builds.

That’s the theory, anyway. A lot of people have complaints about the Unity Remote, saying that it doesn’t work very well or at all.

I’ve always felt that Unity should have a live debug view of the game running on the device that shows you all the GameObjects and their components and serialised fields. I imagined it would look like the regular built-in hierarchy and inspector windows, except it would be pulling the data via a network connection from the live build. A lot of AAA engines have a live update feature like this but Unity has nothing.

In 2014 I started work on a tool to do just this. I built an initial prototype with plans to sell it on the asset store. But then contracting jobs got in the way, and I put the project on hold. Late last year my contract work dried up, and I decided it was time to get back to it and finish it off, so I’ve spent the last four months working on it. It’s now working pretty well:


You can sit in Unity, bring up the Remote Debug window, connect to your device, and see what’s happening on it, just as though you were looking at a build running in the editor. It’s really easy to iterate on things on the device, and I’ve found it especially useful for tweaking touch controls.

Currently it requires Unity 5.3.2f1 or better because I’m using the new Scene.GetRootGameObjects API that was added. I can make it work in previous versions of Unity but with some unfortunate side effects depending on what API I use. If I use Object.FindObjectsOfType I can’t get inactive objects. There is also Resources.FindObjectsOfType but it returns all objects including resources that were manually loaded from the Resources directory. I think I can filter these out, but it just means the server is a bit more costly in terms of memory and CPU. This is something I want to do though because it would be great to provide versions of the tool for Unity 5.x across the board.

I’ve made a thread on the Unity forums about Hdg Remote Debug. If you want more information feel free to post there or email us here at Horse Drawn HQ. The tool should be going live on the asset store in the next couple of weeks.

Visual Studio shader syntax highlighting part 2

I have updated the NShader syntax highlighter to allow adding extra extensions dynamically via the Visual Studio settings. This is one of the most requested features, and it really is a feature that makes sense. The plugin was previously hard-coded to specific file extensions. The reason for this is because that’s just the way you define what file extensions your language service is for in a Visual Studio plugin; you add a bunch of attributes to your Package implementation.

However if you implement the IVsEditorFactory interface, you can get an entry to show up in the VS settings page! You don’t even have to implement the full interface yourself because there is a built-in implementation that does most of the hard work called EditorFactory.

To use this updated version, in Tools->Options->Text Editor->File Extension, add a file extension, select “NShader Editor” in the dropdown, and click “Add”. Then when you open a file with any of those extensions they will use the NShader syntax highlighter. Files will default to using the HLSL highlighter, so if you want to force them to use GLSL, CG, or Unity, you can use the shadertype tag I mentioned in my previous post.

Note that all the file extensions that NShader previously recognised are still recognised, so if you are using any of those file types you don’t have to do anything extra.

It seems that there is a bug in at least Visual Studio 2013 and possibly earlier versions where the setting can be forgotten and when you open a file in the list the syntax highlighting is not applied. However, the extension still appears in the list. To work around this you must remove and re-add the extension to the list. Also in Visual Studio 2015 if you load a file from the “recently used” list it doesn’t seem to use the syntax highlighter, but if you load it from elsewhere (e.g. File->Open or the Solution Explorer) it will work. This seems like a bug in Visual Studio, because it worked in 2013.

If you add a file extension or use the shadertype tag you will need to close and re-open any currently open files to reflect the changes.

An installer for NShader can be downloaded here. The installer can be used to install into both Visual Studio 2013 and 2015.

The source code is available on github here.

Ring buffers / circular buffers

A ring buffer, also known as a circular buffer or cyclic buffer, is a very useful data structure for certain situations, and worth having around in your programmer’s toolchest. It’s a fixed-size buffer but treated as though it’s connected end to end (that is, the end is connected to the start) and data is written and read in a FIFO (first-in first-out) way. Usually this is all hidden behind an API to make it easy to read and write to it.

They are often used when there is a need to read and write data in a streaming manner, for example, streaming audio to a sound card, I/O buffering for a UART in an embedded device, and in fact any I/O buffer situation (e.g. a network device or a disk). Because the buffer is fixed in size you know what the memory footprint will be up front and this makes it ideal for use in embedded systems or on consoles where memory is constrained and you don’t want to dynamically allocate memory.

Overview

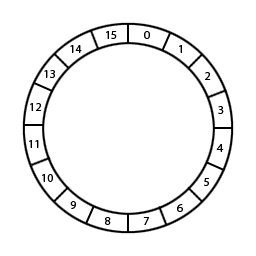
You can imagine a ring buffer as a circular block of memory that cycles around like this (the numbers represent the indices into the block of memory, which is treated as an array of bytes):

ringbuffer1

Fig. 1 – Imaginary ring buffer

But of course in reality the memory is really laid out like this:

ringbuffer2

Fig. 2 – Actual memory layout

The current read and write locations in the buffer are tracked, and the ring buffer operation is as follows:

  • When writing, we copy new data into the buffer starting at the write location, and if the new data goes off the end of the buffer, we wrap around and write the remaining data starting at the start of the buffer, until we have written all data or we run out of space.
  • When reading, we copy data out of the buffer starting at the read location until we have read some specified amount of data, or we reach the write location, wrapping around the end of the buffer as above.

We know we’ve run out of space for writing when we reach the read location, and we know we have no more data to read when we reach the write location. In those cases we can just stop and return the amount of data actually written or read.

Implementation

Phew! That seems complicated! Let’s break this down and look at how we might implement it. We need to keep track of a few things:

  • A pointer to the start of the memory for the buffer.
  • The size of the buffer in bytes.
  • The current read index in the buffer.
  • The current write index in the buffer.

The read and write indices represent where the current read and write location is in the buffer (these could instead be kept as pointers if we wanted).

In my implementation I also choose to track:

  • The number of bytes available for reading.
  • The number of bytes available for writing.

We can actually avoid tracking these two if we want, but it makes everything a bit clearer and doesn’t cost us much more.

We also want to be able to read and write to the buffer. Let’s sketch out a class for what we have so far:

class RingBuffer
{
    public:
        RingBuffer(int sizeBytes);
        ~RingBuffer();

        // Copies 'length' bytes from 'source' to the ring buffer.
        // Returns the number of bytes actually written, which may be less than 'length'
        // if there was insufficient space to write into the ring buffer.
        int Write(const void* source, int length);

        // Reads 'length' bytes from the ring buffer into 'dest'.
        // Returns the number of bytes actually read, which may be less than 'length'
        // if there was insufficient data in the ring buffer.
        int Read(void* dest, int length);

    private:
        char* m_buffer;
        int m_sizeBytes;
        int m_readIndex;
        int m_writeIndex;
        int m_readBytesAvailable;
        int m_writeBytesAvailable;
}

For our write function we’ll clamp the length to the amount of space available for writing, and for our read function we’ll clamp it to the amount of data available in the buffer for reading.

Reading and Writing

We have two possible situations we need to handle when implementing reading and writing. The case where the current write index is greater than the current read index:

ringbuffer3

Fig. 3 – Write index greater than read index

And the case where the current write index is less than the current read index:

ringbuffer4

Fig. 4 – Write index less than read index

For writing in figure 3, we need to split the write up into two regions. The first region is from the current write index to the end of the buffer (index 11 to 15 inclusive), and the second region is from the start of the buffer to just before the current read index (index 0 to 3 inclusive):

ringbuffer5

Fig. 5 – Two regions for writing

For the figure 4 case, we have just one region, from the current write index to just before the current read index (index 1 to 8 inclusive):

ringbuffer6

Fig. 6 – One region for writing

Reading is pretty much the same, but opposite! For reading in the figure 3 case, we just read from the current read index to just before the current write index (index 4 to 10 inclusive). For the figure 4 case we need to split the read up into two regions. The first region is from the current read index to the end of the buffer (index 9 to 15 inclusive), and the second region is from the start of the buffer to just before the current write index (index 0 only).

When there are two regions, it’s possible that the length of data we want to write or read isn’t enough to take us into the second region! So we may only end up requiring one region. Clamping the length makes it easy to determine this without a whole lot of nested if statements, because we can compare the clamped length to the remaining bytes in the buffer from the current read or write index. I think this is easier to explain in code, so putting this all together, we can come up with a write function like this:

int RingBuffer::Write(const void* source, int length)
{
    assert(m_buffer);
    assert(source);
    assert(length >= 0);
    assert(m_writeBytesAvailable >= 0);

    // If there is no space or nothing to write then don't do anything.
    if (m_writeBytesAvailable == 0 || length == 0)
        return 0;

    // Clamp the length to the number of bytes available for writing.
    if (length > m_writeBytesAvailable)
        length = m_writeBytesAvailable;

    int remainingWriteBytes = m_sizeBytes - m_writeIndex;
    if (length > remainingWriteBytes)
    {
        // If the number of bytes to write is bigger than the remaining bytes
        // in the buffer, we have to wrap around and write into two regions.
        memcpy(m_buffer + m_writeIndex, source, remainingWriteBytes);
        memcpy(m_buffer, (char*)source + remainingWriteBytes, length - remainingWriteBytes);
    }
    else
    {
        // No wrapping, only one region to write to, which starts from the write index.
        memcpy(m_buffer + m_writeIndex, source, length);
    }

    // Increment the write index and wrap around at the end.
    m_writeIndex = (m_writeIndex + length) % m_sizeBytes;

    // Update the read and write sizes.
    m_writeBytesAvailable -= length;
    m_readBytesAvailable += length;

    return length;
}

Our read function will look pretty similar:

int RingBuffer::Read(void* dest, int length)
{
    assert(m_buffer);
    assert(dest);
    assert(length >= 0);
    assert(m_readBytesAvailable >= 0);

    // If there is no data in the buffer or nothing to read then don't do anything.
    if (IsEmpty() || length == 0)
        return 0;

    // Clamp the length to the maximum number of bytes available for reading.
    if (length > m_readBytesAvailable)
        length = m_readBytesAvailable;

    int remainingReadBytes = m_sizeBytes - m_readIndex;
    if (length > remainingReadBytes)
    {
        // If the number of bytes to read is bigger than the remaining bytes
        // in the buffer, we have to wrap around and read from two regions.
        memcpy(dest, m_buffer + m_readIndex, remainingReadBytes);
        memcpy((char*)dest + remainingReadBytes, m_buffer, length - remainingReadBytes);
    }
    else
    {
        // No wrapping, only one region to read from, which starts from the read index.
        memcpy(dest, m_buffer + m_readIndex, length);
    }

    // Increment the read index and wrap around at the end.
    m_readIndex = (m_readIndex + length) % m_sizeBytes;

    // Update the read and write sizes.
    m_writeBytesAvailable += length;
    m_readBytesAvailable -= length;

    return length;
}

And that’s it! There is a full implementation available here. Note that it makes no attempt to be thread safe! You should lock as appropriate if you use this in a multi-threaded environment.

Next time we’ll look at using this class to dynamically generate a continuous audio stream!

The case of the continually checked out prefabs

I’ve been helping out my friends over at Three Phase Interactive on their game Defect: Spaceship Destruction Kit a little bit. The game is being developed in Unity, and they’re using Perforce for source control. We’re using different combinations of the built-in Unity Perforce support and the P4Connect plugin. We’ve had a strange issue in Unity for a while now where it would try to check out two specific prefabs seemingly randomly. There seemed to be no reason why, as the prefabs weren’t directly being changed!

After much searching around and digging, I was able to discover the reason for this. If you have a prefab in your project with a MonoBehaviour which implements the OnValidate function, Unity will at times execute the OnValidate on prefabs that aren’t in the current scene and are not even selected in the project tab.

In the OnValidate, if you assign any values to certain members, Unity then flags the prefab as dirty, and thus when you save the project it decides that it needs to be checked out of source control. In our case the values weren’t actually changing; they were being set to the same as their initial values, so the prefabs would be checked out but then there wouldn’t be any changes in the file.

The most common times when Unity runs OnValidate appear to be when entering play mode, and when Unity rebuilds after code has changed.

I was able to reproduce this behaviour in a small test project, but only when modifying properties of the GameObject‘s transform (e.g. setting transform.rotation to identity). Setting serialised class members didn’t seem to trigger this issue, so it seems that it only happens if you set built-in Unity properties (maybe it hooks into the property setter).

In SDK the way I solved this was to add this code to the top of the OnValidate methods:

#if UNITY_EDITOR
   if (gameObject.hideFlags == HideFlags.HideInHierarchy)
      return;
#endif

However in my test project, that didn’t work, and I had to instead do this:

if (transform.rotation != Quaternion.identity)
   transform.rotation = Quaternion.identity;

I suspect that only changing the values if they are different is the more reliable method; in SDK prefabs seemed to be set to HideInHierarchy but that wasn’t the case in my test project. I’m not sure why as I couldn’t see anywhere where it was changing the hide flags, so I may have to go back and change it in SDK.

It took a while to figure this out, but it was thanks to a post over on the NGUI forums here and a post on Unity answers here that I was able to track this down!

Shader syntax highlighting in Visual Studio 2013

If you edit shader code in Visual Studio 2013, you might like to use NShader to get syntax highlighting. NShader was originally written by Alexandre Mutel. His version is available here but it only supports VS2008, VS2010, and VS2012. Issam Khalil had forked it and added VS2013 support, as well as Unity shader highlighting.

I’ve forked Issam’s code and added a couple of features. The installer for the extension can be downloaded here. This installer can be used to install into both Visual Studio 2013 and 2015.

You can now override the file type detection by specifying, on the first line of a shader file, a comment like so:

// shadertype=<type>

where <type> is one of:

hlsl
glsl
cg
unity

This will force the file to use the specified syntax highlighter. This is case sensitive and must appear exactly as above. Otherwise if the shadertype tag is not present, the file extension will be used to decide what type of highlighting to use. The following extensions are recognised:

HLSL syntax highlighter – .fx, .fxh, .hlsl, .vsh, .psh, .fsh
GLSL syntax highlighter – .glsl, .frag, .vert, .fp, .vp, .geom, .xsh
CG syntax highlighter – .cg, .cgfx
Unity syntax highlighter – .shader, .cginc, .compute

The keyword mapping files that can be placed in %APPDATA%\NShader now override the built-in mappings. For example, if float is mapped as a keyword in the built-in mapping for GLSL, it can be changed to a type by adding the following line to %APPDATA%\NShader\GLSLKeywords.map:

TYPE=float

Multiple words can be specified on a single line by separating them with spaces or tabs. The zip file contains the built-in keyword mapping files as examples.

I’ve also added a separate colour setting for anything that is defined as a type. This should appear in Tools > Options > Environment > Fonts and Colors in the display items list for the text editor colours. Scroll down to ‘n’ and you should see all the NShader colour settings. The new setting is ‘NShader – Type’.

If you are having troubles with files not highlighting, try uninstalling NShader first via Tools > Extensions and Updates. Also make sure you restart Visual Studio after installing NShader!

BinaryFormatter on iOS

If you’re trying to use a BinaryFormatter under iOS you may discover that it doesn’t work. You may get exceptions like “ExecutionEngineException: Attempting to JIT compile method ..”. This is because by default the mono BinaryFormatter uses runtime generated class serializers. This won’t work on iOS because JIT compilation is not permitted. To get around this, you can force mono to use reflection to perform the serialization instead. You can do this by inserting this line:

Environment.SetEnvironmentVariable("MONO_REFLECTION_SERIALIZER", "yes");

somewhere in your project (e.g. in the Awake() method of the MonoBehaviour that needs to use serialization).

You could also instead use protobuf-net, which is a serializer for .NET that uses Google’s Protocol Buffers.