Wow it’s been a while since I updated the blog! I think we’re due for a web site refresh too. But first let’s talk about call stacks!
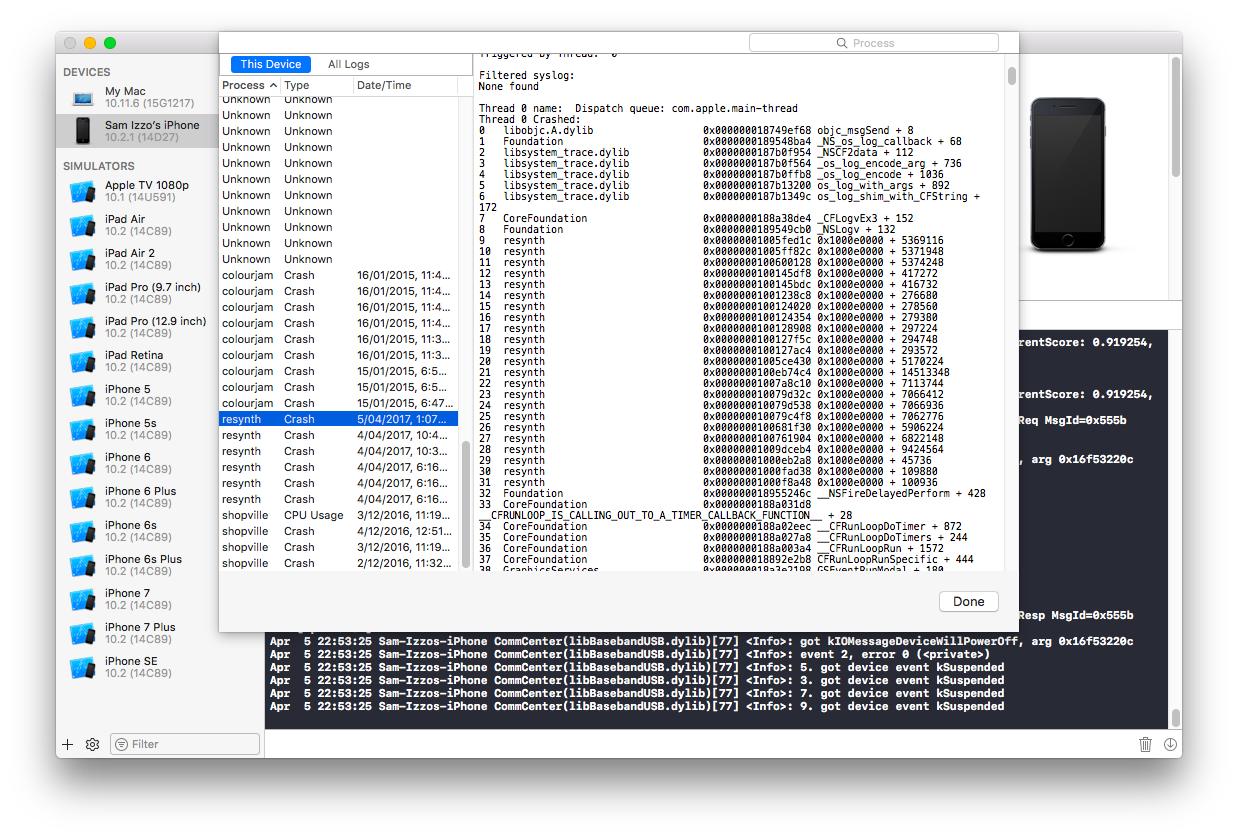
Let’s say your iOS game crashes outside of the debugger. Assuming your device is plugged into your mac, you can get the device log from Xcode by bringing up the “Devices” window via Window -> Devices. You should see a live updated log and you might be able to find your crash details in among the spammy output. But even better – if you click on “View Device Logs” you’ll see a list of apps that have crashed.

In this example, Resynth (a game I’ve been working on for my new company Polyphonic LP) has crashed a couple of times, and I’ve selected one of the crashes.
Why did it crash? Luckily we have the full call stack. A call stack is simply a list of functions that are currently being executed by the CPU. In this case, the call stack looks like this:
Thread 0 Crashed:
0   libobjc.A.dylib               	0x000000018749ef68 objc_msgSend + 8
1   Foundation                    	0x0000000189548ba4 _NS_os_log_callback + 68
2   libsystem_trace.dylib         	0x0000000187b0f954 _NSCF2data + 112
3   libsystem_trace.dylib         	0x0000000187b0f564 _os_log_encode_arg + 736
4   libsystem_trace.dylib         	0x0000000187b0ffb8 _os_log_encode + 1036
5   libsystem_trace.dylib         	0x0000000187b13200 os_log_with_args + 892
6   libsystem_trace.dylib         	0x0000000187b1349c os_log_shim_with_CFString + 172
7   CoreFoundation                	0x0000000188a38de4 _CFLogvEx3 + 152
8   Foundation                    	0x0000000189549cb0 _NSLogv + 132
9   resynth                       	0x000000010056ac28 0x10004c000 + 5368872
10  resynth                       	0x000000010056b654 0x10004c000 + 5371476
11  resynth                       	0x000000010056bdd4 0x10004c000 + 5373396
12  resynth                       	0x00000001000b13f4 0x10004c000 + 414708
13  resynth                       	0x0000000100081c94 0x10004c000 + 220308
14  resynth                       	0x00000001000816f4 0x10004c000 + 218868
15  resynth                       	0x000000010053a33c 0x10004c000 + 5169980
16  resynth                       	0x0000000100e23404 0x10004c000 + 14513156
17  resynth                       	0x0000000100714b54 0x10004c000 + 7113556
18  resynth                       	0x0000000100714f24 0x10004c000 + 7114532
19  resynth                       	0x0000000100708054 0x10004c000 + 7061588
20  resynth                       	0x0000000100709db4 0x10004c000 + 7069108
21  resynth                       	0x000000010070a0a8 0x10004c000 + 7069864
There isn’t much symbol information; the only thing we can really see is that the NSLog function was running. But what called NSLog and what caused it to crash?
Fortunately there are several tools we can use to decode this. I’m going to cover one of them today: atos. atos converts memory addresses to symbol names, and it comes with macOS and lives in /usr/bin so it should already be in your path. It takes a couple of parameters:
atos -arch <architecture> -l <load address> -o <path to debug binary> <addresses>
We need to supply the architecture of our binary, the load address (the base address in memory where the executable was loaded), the path to a version of our binary with full debug information present, and the list of call stack addresses that we wish to translate into symbols.
If you have archived your game from Xcode, the full debug executable can be found inside the archive, in dSYMs/resynth.app.dSYM/Contents/Resources/DWARF.
Our architecture is arm64 (unless you’re running arm7 which is unlikely these days).
For this crash our load address is 0x10004c000. The load address could be anything and won’t always be the same. Sometimes the load address might not be present, and the call stack lines might look something like this:
9 resynth 0x000000010056ac28 resynth + 5368872
This can happen if you get your crash information from the device log view in Xcode instead of from the specific application crash view.
Here 0x000000010056ac28 is the real memory address where this particular function was loaded, and 5368872 is the offset of the function from the load address. We can therefore easily calculate the load address; it’s just 0x000000010056ac28 - 5368872 which is 0x10004C000.
Now we have everything we need, so let’s run this!
$ atos -arch arm64 -l 0x10004c000 -o resynth-debug 0x000000010056ac28 0x000000010056b654 0x000000010056bdd4
CM_NSLog(NSString*, ...) (in resynth-debug) (CloudManager.mm:17)
-[CloudManager getLongLong:] (in resynth-debug) (CloudManager.mm:171)
getLongLong (in resynth-debug) (CloudManager.mm:225)
In the interests of brevity I’ve used only the three top most addresses. This is usually enough to figure out the problem anyway!
In this case the culprit turns out to be the getLongLong Objective-C method:
- (long long) getLongLong:(NSString *)key
{
    NSUserDefaults* userDefaults = [NSUserDefaults standardUserDefaults];
    long long value = [[userDefaults objectForKey:key] longLongValue];
    DEBUG(@"CloudManager: getLongLong key=%@ value=%@", key, value);
    return value;
}
On line 5 we specify a string with the %@ format specifier, which means we should be passing in an NSObject-derived object. However, we are instead passing a long long value which causes a crash.
The fix is simple. We just convert the long long to an NSObject:
DEBUG(@"CloudManager: getLongLong key=%@ value=%@", key, @(value));

Any chance you can give us a writeup about doing this on Android devices as well?
I’m actually going to be starting on the Resynth Android build soon so yeah I’ll look into it and write it up!